Building a Simple Analytics Replacement
Published on
I've used Google Analytics on my site(s) for many, many years. It's fine. I honestly don't really have a problem with it from a developer's perspective. That said, I don't need all the things it does, and I fully understand the concerns of many people with the various tracking methods employed by Google and (many) others.
So, what other solutions exist? And what about for a static site where I don't get access to the server logs? And as a static site, how could I do this on my own without server-side storage?
Well, the short answer is: you can't do it without some storage somewhere, but that doesn't mean switching from a static site to a full blown client-server setup. In this post, I'll show you how I used Netlify Functions and Blobs to create a simplified Google Analytics alternative that you can deploy for free (up to a point).
The Setup
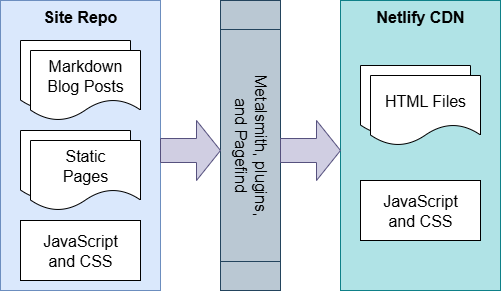
Let's back up a minute to show you how my site is created and deployed before we jump into the analytics part. At its core, this is markdown content with a build step that produces HTML, CSS, and JavaScript assets which are then deployed to a CDN - in my case, via Netlify. I use Netlify because its free-tier is great and it has auto-publication with GitHub integration. (I've been using Netlify for quite a while now, before they even introduced Functions and Blobs, which you'll read about later.)
I use an open source tool called Metalsmith for the basic build process which has some great built-in features as well as a super easy to use plugin system for the few extra things I need. Basically, it takes source files and metadata and produces the output files in a destination of your choosing. In my case, it takes markdown content, reads the front matter, and generates both individual content HTML pages as well as the list of posts, pagination artifacts, and even a front-end-only site search that requires no external site using a separate tool called Pagefind.
I'm not going to get into all of the tools, how they are configured, and how they work together to produce the final site. (Maybe that's a future post?) However, all of the code for my site is open source, so check it out!
How Users are Tracked
Well, first of all, the user isn't really tracked... not in the way that you might think of from what Google and others do. My site generates an identifier using the open source FingerprintJS library which is (more or less) a compilation of device-identifying info. Notably, it is not cookie-based. In fact, if you look at the cookies for this site in your browser you will notice there are none.
The identifier that is generated is then associated with the pages viewed along with the date and time. If present, it also logs the referrer URL so I know where people find my site elsewhere on the web. The user's timezone is used to determine their geographic location - it's not perfect, but it works as a decent proxy.
That's it. That's all the data.
Here's an example of the data sent for someone visiting this page, if they came from a LinkedIn and were on the East Coast of the United States:
{
    "v":{
        "id": "af2c63849b7fdfc71e8d57c2d906d160",
        "tz": "America/New_York"
    },
    "h":[
        {
            "p": "/building-a-simple-analytics-replacement/",
            "q": "",
            "r": "https://www.linkedin.com/",
            "t": 1756912213282
        }
    ]
}
As you can see, there's really not that much to it. Currently I'm not tracking query terms - mostly because those don't typically come through the referrer URL, and - as mentioned earlier - I don't have access to the request headers because I don't have a server! What might be more important is that this information is not tracked in a cookie or any other client-side storage, and because of this, it can't be tracked across other sites you visit on the web.
Processing the Tracker
We don't have a server, but luckily Netlify Functions have us covered. These work similar to other serverless functions on AWS, Azure, etc., but are easier to set up (in my opinion). Even better for us, the free tier allows for 125,000 requests per month and 100 hours of runtime. This should be plenty for a personal website unless you're the Obamas or Kardashians.
On the front end, we collect the info and send a really simple GET request to the endpoint. You can see the front end code on GitHub, but the basics are below. (I've left out a few bits below for readability.)
You'll see at the end that I convert the data to base 64. This is probably unnecessary, but is side-steps a lot of URL encoding issues.
;(async function () {
    let fp = fp = (await (await FingerprintJS.load()).get()).visitorId
    const visitor = {
        id: fp,
        tz: Intl.DateTimeFormat().resolvedOptions().timeZone
    }
    const hit = {
        p: window.location.pathname || '/',
        r: document.referrer,
        t: Date.now()
    }
    await fetch(`/.netlify/functions/processVisit?data=${btoa(JSON.stringify({ v: visitor, h: [hit] }))}`)
})();
The serverless function will check the data and store it, then sends back a simple "success" response. You can see the entire code for this processing on GitHub as well. I'm not posting it here because it's quite a bit longer. However, the documentation on Netlify's site is pretty good.
Here's the main points:
- You don't have to put everything in a
netlify/directory... I didn't want to, and you can configure that in your Project configuration under "Build settings". - In my case I used plain JavaScript (versus TypeScript), but either way you need a function that is exported and accepts a
Requestobject and the execution context. - Remember that this is an asynchronous function whether you use the
asynckeyword or not, so might as well take advantage of it. - Make sure you return a native JS
Responseobject! In my case, it's super basic:return new Response('success', { status: 200 })
Storing the Tracker Data
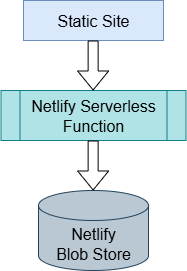
As you look through the serverless function, you'll note that I am using Netlify Blobs for storing the data. This is a basic key-value store and is still pretty new for Netlify. Being so new, there is not (yet) billing info or free tier usage restrictions. There is a post on their knowledge base acknowledging this, and a suggestion there there will be a free tier, maybe at 100GB (which is quite generous... might not trust that) and that each GB over that limit would cost some number of cents per month.
Our storage should be really small, so even a few Gigabytes should work fine.
Being a simple key-value store, the basic steps are:
1. Create/Retrieve the store
import { getStore } from '@netlify/blobs'

const store = getStore({ name: 'my-store-name' })
We'll talk about those environment variables when we get to the local testing section.
2. Save the data
const data = JSON.parse(atob(request.url.split('?data=')[1]))
const result = await store.setJSON(`hit-${Date.now()}`, data)  // I actually store this data by YYYY-MM-DD
if (!result) {
    console.warn(`Unable to update analytics data!`)
}
Okay, there's a LOT more to it than that, but that's the basics. In reality, I extract, validate, and sort the data into 3 parts, merging that data in with the existing data, and put that back into 3 different keys within the store.
As mentioned, I encourage you to look at the actual code on GitHub that does the processing and storing of the data!
The Data Schema
I made a quick reference schema file for myself because I was losing track of what data was where. Note that I shortened all property names to save on Blob storage space.
There are 3 keys in the analytics Blob store:
1. All Visitors
This is an object of all visitors to the site by fingerprint along with their geography, first visit timestamp, and last visit timestamp - that gets me whether or not they are a return visitor, which I like to know.
2. All visited paths
Each path that has been visited to the site is stored by it's path along with a unique ID. This is so that I can store only the ID in the per-date hit data versus the full path (which can be quite long). I don;t store other data here (like all-time views), but you could!
3. Hit data by date
Unlike the other two store keys (visitors and paths), the bulk of the hit data is stored with a new key for each date (YYYY-MM-DD). I found that I really only care about data at the 1-day frame of reference, so I roll it up to that. Within each day, I store data by path ID (see #2 above) and the count of hits (page views). I also store a set (JSON array) of each visitor fingerprint and referrer URL. That let's me see the number of unique visitors to each page and the (external or internal) site that brought them to that page.
Visualizing the Data
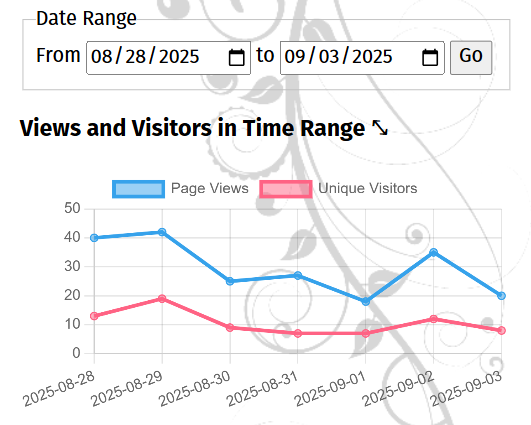
Now that we have the data stored, I needed a way to actually view my site's analytics. This actually took just as long as figuring out how to store the data! For this, we actually have a separate serverless function to retrieve the analytics for a given date range.
This one is much more simple. It validates the provided date range (or uses the default) and returns the given data. There's a tiny bit of processing, but really that could be done on the front end just as easily.
The front end code for the analytics UI uses the open source Chart.js library to visualize the number of visitors and page views on a line chart. Then we have some plain old HTML tables with other visitor data, pages viewed, and referral URLs.
Although this UI doesn't have all the bells and whistles and drill-down abilities of Google Analytics, I find it works just fine for my needs. If was commercializing my site, I would likely want more data and more abilities to visualize that data, but I'm not!
Issues and Pitfalls
Here's the big one: Netlify Functions do not have a way to restrict execution to the origin domain. In other words, if someone knows that you have a serverless Function out there, they could easily DDoS it, or just send junk data. On the first issue, I would hope that Netlify fixes this... but also, the origin header can easily be spoofed in a cURL request. On the second, that's why you have good data validation in your function code, and maybe a way to clean that data if you need to. I don't have that last part, but it wouldn't be too difficult to do so.
I will note that Netlify does have a way to configure rate limiting for your functions, which could effectively be used to block an individual IP addresses, so that could help with the first issue above as well.
Luckily, the Blob Store is behind that serverless function and has token-based access control on the server-side. That should mean that a malicious actor can't wipe your data or change past data... but as mentioned, they could add data.
Second, there's no (easy/free) way to restrict access to your analytics UI. This isn't a huge deal for me - in part because I have no sensitive data on there and because it's a small site with limited traffic. But your experience may be different. You can implement access control using Netlify paid features, but that's beyond this article!
Testing Locally
I found it difficult to find good information on testing locally with Netlify, but it is easy, you just have to know the right levers to pull. Netlify provides a nice dev command in their CLI for local testing. This is a good way to ensure your site works locally as it will when deployed to Netlify (versus using a simple local static server).
It will also run your serverless functions locally, which is awesome, and it even runs a Blob store server with local data storage.
One last note here: while Netlify's dev CLI command has an --offline option (which I encourage you use exclusively for efficiency), you will need to have your publish directory in a netlify.toml configuration file in your project directory for that to work (unless the root directory of your project is the publish directory). And if you configured a different directory for your serverless functions, you'll need to put that in the netlify.toml as well. You need to do this even if you configure things on the web dashboard, but only if you want to run the dev command offline.
So, to recap, to test locally (and offline) you need to:
- Specify your publish (and maybe functions) directory in a local
netlify.tomlfile - Build your static site files (I use
npm run build, which you can see in mypackage.json file) - Start the Netlify dev instance using
netlify dev(possibly with--offline) - Profit?
What's Next?
There's a lot of things I would like to do with this. In particular, be more efficient with my date lookups. If I go more than about 3 weeks in the date range the serverless function drags. It would be better to roll up data past that point to weekly data. I think it would also be great to have the data automatically roll up after X months, to save on space. Of course, I'm not too worried about that yet.
I think the UI is fine, but I'd like to add sorting to the table columns, and maybe some drill-down or cross-reference functionality. Otherwise, I'm pretty happy with it for my purposes!
What would you want to see done differently?